

The lockdown due to a novel coronavirus (COVID–19) pandemic negatively impacted the daily physical activity levels and sedentary behavior of children and adolescents. The purpose of this study was to determine the effects of lockdown on the anthropometric measurements, aerobic capacity, muscle function, lipid profile and glycemic control in overweight and obese children and adolescents.
Methods104 children and adolescents with overweight and obesity were divided in a non-lockdown group (NL) (n = 48) and a lockdown group (L) (n = 56). Both NL and L groups were evaluated on three consecutive days, day one: anthropometric measurements; day two: aerobic capacity and muscle function and day three: lipid profile and glycemic control. Data are presented as mean ± standard deviation (SD) and median plus interquartile range (IQR) according to their assumption of normality.
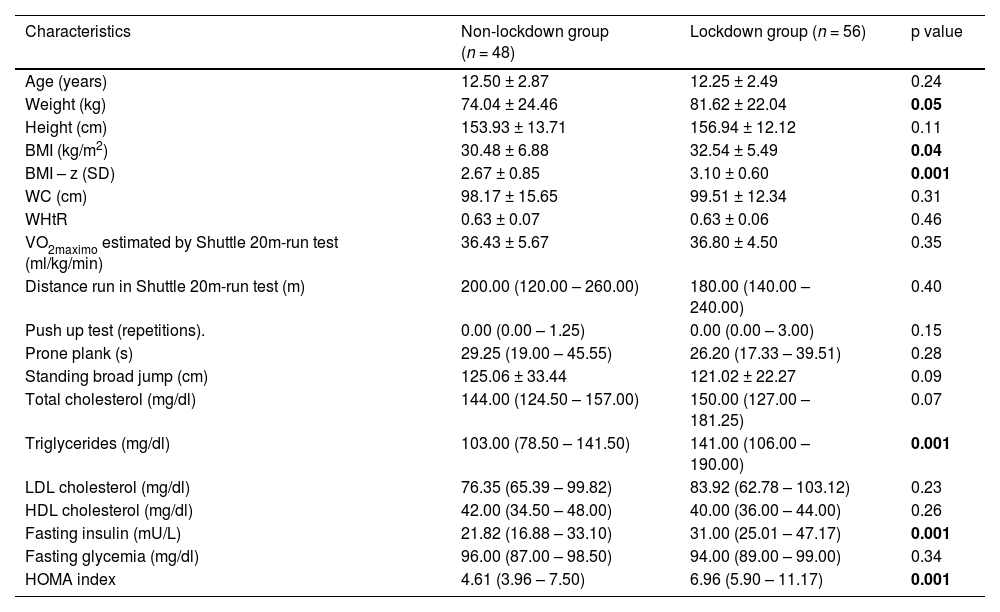
ResultsThe L group increased the body weight (81.62 ± 22.04 kg vs 74.04 ± 24.46 kg; p = 0.05), body mass index (32.54 ± 5,49 kg/m2 vs 30.48 ± 6.88 kg/m2; p = 0.04), body mass index by z-score (3.10 ± 0.60 SD vs 2.67 ± 0.85 SD; p = 0.0015), triglycerides [141.00 mg/dl IQR (106.00– 190.00 mg/dl) vs 103.00 mg/dl IQR (78.50– 141.50 mg/dl); p = 0.001], fasting insulin [31.00 mU/L IQR (25.01– 47–17 mU/L vs 21.82 mU/L IQR (16.88 – 33.10 mU/L; p = 0.001)] and HOMA index [6.96 IQR (6.90 – 11.17) vs 4.61 IQR (3.96 – 7.50; p = 0.001)] compared with NL group.
ConclusionsThe lockdown due COVID–19 pandemic had a negative impact on the anthropometric measurements, lipid profile, and glycemic control of overweight and obese children and adolescents.
The lockdown due to the novel coronavirus (COVID–19) has generated a negative impact on the health of the pediatric population, in this sense, a reduction in physical activity of around 50% has been reported in children and adolescents aged 5 to 8 years, and 65% between 9 and 13 years.1 In the same way, there has been evidence of an increase in sedentary behavior, represented by screen time.2
The decrease in daily physical activity is strongly associated with the increase in body mass index (BMI),3 evidenced by showing differences of up to 1.4 h of daily physical activity between normal weight and overweight children.4 In this sense, the percentage of obesity increases from 8% to 35% when the sedentary behavior measured by screen time is greater than 180 min a day.5
The levels of daily physical activity have a strong relationship with maximal oxygen consumption (VO2max), reporting a positive correlation between the numbers of daily physical activity and the VO2max.4 Furthermore, the proper functioning and maintenance of muscle mass in the pediatric stage depends on levels of daily physical activity of around 60 min per day at moderate or vigorous intensity.3 In the same line, it has been reported that the longer the sedentary time measured by screen time, both lipid profile and glycemic control are negatively influenced.6
The objective of this retrospective study was to determine whether the confinement due to COVID–19 pandemic affected the anthropometric measurements, aerobic capacity, muscle function, lipid profile, and glycemic control in overweight and obese children and adolescents.
Material and methodsParticipantsAn anonymous database of children and adolescents who entered the cardiometabolic rehabilitation program of the Hospital Dr. Exequiel González Cortes, Santiago, Chile during two periods was used. The first period from January 10, 2019, to February 28, 2020, this period was denominated non-lockdown group (NL) and the second period from June 25, 2020, to September 09, 2021, denominated Lockdown group (L). The inclusion criteria for the admission were children and adolescents between 7 – 17 years of age who were overweight [body mass index by z - score (BMI - z) > +1 and < +2 standard deviation (SD)], obese (BMI - z > +2 and < + 3 SD) and severe obesity (BMI - z > +3 SD). The exclusion criteria were: moderate and severe cognitive disabilities, a musculoskeletal condition that prevents normal physical activity, and severe heart disease that contraindicates the practice of physical activity.
The participants were divided into two groups whose characteristics are shown in Table 1. The first group denominated Non-lockdown (NL) consisted of 48 children and adolescents (12.50 ± 2.87 years), 23 female and 25 male. The second group denominated Lockdown group (L) consisted of 56 children and adolescents (12.25 ± 2.49 years) 26 female and 30 male. All the participants were recruited from the geographic area belonging to the South Metropolitan Health Service whose economic characteristics are low income. This study was approved by the ethics committee of the South Metropolitan Health Service, code 63 – 31,082,021, following the Helsinki Declaration.
Characteristics of the subjects participating in the study.
Mean ± standard deviation; Median (Inter Quartile Range); BMI, Body Mass Index; BMI – z, Body Mass Index by z – score; HDL, High Density Lipoprotein; HOMA, Homeostasis Model of Assessment; mg/dl, milligrams/deciliter; mU/L, milliunits/liter; LDL, Low Density Lipoprotein; WC, Waist Circumference; WHtR, Waist to Height ratio; VO2maximo, Maximal Oxygen Consumption.
This study was a retrospective, analytic and observational type, the children and adolescents admitted to the cardiometabolic rehabilitation program, were evaluated by a sports doctor, kinesiologist and physical activity and health therapist belonging at the sports and medicine unit of the Hospital Dr. Exequiel González Cortés (HEGC), during 3 consecutive days, the evaluation consisted of:
Day 1: Pre-participative cardiovascular assessment and anthropometric measurements such as body weight, height, BMI, BMI – z, waist circumference (WC), and waist-to-height ratio (WHtR).
Day 2: Muscle function measured by push-up test, prone plank, and standing broad jump and aerobic capacity measured by 20-m Shuttle run test.7
Day 3: Blood samples for lipid profile and glycemic control. Blood samples were taken fasting at 8 – 12 h in the HEGC laboratory.
Body weight and height were measured using a SECA ® scale. The WC was measured with an inextensible tape measure, following the Ruiz et al.8 protocol. With the data obtained, the BMI, BMI – z, and WHtR were calculated.
Shuttle 20-m run test
The test consisted of running 20 m round trip at an initial incremental speed of 8.5 k/h, which increases by 0.5 k/h per minute.8 The maximal oxygen consumption (VO2max) was estimated using the Léger et al.7 formula. The VO2max in ml/kg/min and the distance covered (m) were used for the data analysis.
Push up testParticipants were positioned on the mat, only the hands and feet resting at shoulder height and performed maximum repetitions of trunk elevation with 90° elbow flexions.9 Maximum repetitions (rep) were considered for data analysis.
Prone plankThe elbows and toes were allowed to touch the mat, maintaining the isometric position for as long as possible. For the data analysis, the total time recorded in seconds was used10
Standing broad jumpThe patient stood behind the jumping line on a non-slip surface, with feet shoulder-width apart. From that position, the evaluator asked the subject to jump as far as possible and touch the floor with both feet at the same time. Three attempts were made and the best distance performed in centimeters (cm) was considered for the data analysis8
Laboratory samplesVenous blood samples were collected at rest and fasting for 8 to 12 h. They were performed by a certified phlebotomist in the sampling laboratory of the Hospital Dr. Exequiel González Cortés. Lipid profile, fasting insulin, and fasting glucose analyses were performed by an expert medical technologist, using the following techniques: enzymatic determination method for total cholesterol, Friedewald technique for LDL cholesterol, direct glycol measurement for HDL cholesterol, electrochemiluminescence for fasting insulin and hexokinase for fasting glucose. The HOMA index was calculated as fasting insulin (mU/L) by fasting glucose (mg/dl) divided by 405.
Statistical analysisA Shapiro-Wilk test was used to determine the normality of the data. Student's t-test was used for unpaired samples to determine the differences in the dependent variables with normal distribution for the NL and L group. While the Mann–Whitney test for unpaired samples was used for the dependent variables without normal distribution. All the statistical analyses were performed with PRISM 8.0 (GraphPad®, California). Statistical significance was set in p ≤ 0.05. Data are presented as means plus standard deviation (mean ± SD) for variables with normal distribution and median plus their Interquartile Range (IQR) for variables without normal distribution.
ResultsAnthropometric measurementsSignificant differences were found between the NL versus L group for body weight (Figure 1A) (NL 74.04 ± 24.46 kg; L 81.62 ± 22.04 kg; percentual difference: 10.8%; p = 0.05), BMI (Figure 1B) (NL 30.48 ± 6.88 kg/m2; L 32.54 ± 5.49 kg/m2; percentual difference: 6.7%; p = 0.04) and BMI – z (Figure 1C) (NL 2.67 ± 0.85 SD; L 3.10 ± 0.60 SD; percentual difference: 16.1%; p = 0.0015). On the other hand, no significant differences were found between the NL versus L group for height (p = 0.11), WC (p = 0.31) and WHtR (p = 0.46).
Aerobic capacity, body mass index (B) and body mass index by z – score (C) of participants, data are mean and standard deviation of the non-lockdown group (NL) and Lockdown group (L). * Statistical significant difference between NL and L.")
No significant differences were found between the NL versus L group for VO2max estimated by the Shuttle 20-m run test (p = 0.35) and the distance covered in the Shuttle 20-m run (p = 0.40).
Muscle functionNo significant differences were found between the NL versus L group for a push-up test (p = 0.15), prone plank (p = 0.28), and standing broad jump (p = 0.09).
Lipid profileSignificant differences were found for triglycerides (Figure 2A) [NL 103.00 mg/dl IQR (78.50 – 141.40 mg/dl); L 141.00 mg/dl IQR (106.00 – 190.00 mg/dl); percentual difference: 36.8%; p = 0.001]. On the other hand, no significant differences were found between the NL versus L group for total cholesterol (p = 0.07), LDL cholesterol (p = 0.23), and HDL cholesterol (p = 0.26).
Glycemic control fasting insulin (B) and HOMA index (C) data are median and interquartile range of the non-lockdown group (NL) and Lockdown group (L). * Statistical significant difference between NL and L.")
Significant differences were found between the NL versus L group for fasting insulin (Figure 2B) [NL 21.81 mU/L IQR (16.88 – 33.10 mU/L); L 31.00 mU/L IQR (25.01 – 47.17 mU/L); percentual difference: 42.1%; p = 0.001] and HOMA index (Figure 2C) [NL 4.61 IQR (3.96 – 7.50); L 6.96 IQR (5.90 – 11.17); percentual difference: 50.9%; p = 0.001]. No significant differences were found between the NL versus L group for fasting glycemia (p = 0.34).
DiscussionThe results of this retrospective study showed that the lockdown due to COVID–19 pandemic generated a negative impact on body weight, BMI, BMI – z, triglycerides, fasting insulin and HOMA index in overweight and obese children and adolescents.
If the authors compared the NL versus L group, the present results show an increase of 6.82 kg (10.12%) in body weight, 1.95 kg/m2 (6.75%) in BMI and 0.37 SD (16.10%) in BMI – z in the L group. The present results regarding weight are in line with a meta-analysis of Chang et al.11 that showed increases in body weight of pediatric patients around 2.77 kg. Similarly, the BMI reported a similar behavior with augmentation of 1.11 kg/m2 and 0.26 kg/m2 in children and adolescents between 6 and 11 and 12–18 years12 Likewise, Basterfield et al.13 reported an increase of the BMI – z around 0.25 SD, these results are similar to those reported by us.
The negative anthropometric changes experimented on by the L group could be explained by various factors. The first is an abrupt decline in the levels of daily physical activity of the pediatric population.1,2 The second, is the increase in sedentary behavior, during the lockdown the screen time of more than 180 min a day in children and adolescents reached 30.1%, while these values during the period prior to the confinement oscillated around 3.5%.14 Third, changes of the alimentary behavior were reflected in the Children's Eating Behavior Questionnaire, which demonstrated negative changes in emotional overeating, food responsiveness, food enjoyment, and appetite.15 In addition, food preferences change with increases in the consumption of refined carbohydrates with a decrease in the consumption of fruits and vegetables.16
Interestingly, no changes were found in the VO2max estimated by the Shuttle 20-m run test, nor in the distance covered in NL and L comparison. Overall, the evidence on this point was inconclusive. López-Bueno et al.17 did not show a decrease in VO2max (−0.5 ± 0.3 ml/kg/min; p = 0.12) before and after the lockdown in Spanish children, in the same line as Medrano et al.18 reported no changes (60.0 m; p = 0.18) in estimated distance run by Shuttle 20-m run test before and after a lockdown in Spanish children, the evidence showed was similar to the present results in VO2max (0.37 ml/kg/min) and distance run (−20 m). On the other hand, Chambonnière et al.19 reported a decrease in the VO2max estimated by the Shuttle 20-m run test (2.51 ml/kg/min; p < 0.0001), while Basterfield et al.13 also showed a decrease in the distance covered in the Shuttle 20-m run test (60.9 ± 9.1; p < 0.0001) both studies before and after the lockdown in a pediatric population.
The authors hypothesized that the lack of changes in the VO2max estimated by the Shuttle 20-m run test could be due to poor baseline values in the study population. Thus, Tomkinson et al.20 developed normative values for maximum oxygen consumption measured by Shuttle 20-m run test in the male and female pediatric population between 9 and 17 years of age, if the authors take as a baseline the median of the present sample age and sex, the values pre and post lockdown are in the 20th IQR percentile (10 – 20).
No differences were found between the NL versus L group in the push-up test, prone plank, and standing broad jump. The present results in relation to muscle function in the literature are scarce and only refer to the standing broad jump, which showed mixed results. Basterfield et al.13 reported an increase in the standing broad jump performance (6.8 ± 13.1 cm), while Chambonnière et al.19 and Béghin et al.21 showed a decrease around 34.6 and 23.3 cm respectively. The present results reflected a downward trend in performance that did not reach statistical significance. Therefore, the authors hypothesized that poor baseline performance of the standing broad jump22 20th percentile IQR (10 – 30) would be a determinant factor due to the complexity of decrease, even more, the deteriorating performance values, the same hypothesis would apply for push-up test23 [10th percentile IQR (10 – 10)] and prone plank24 [10th percentile IQR (10 – 50)].
Metabolic control represented by the lipid profile and glycemic control showed deleterious changes expressed by increased triglycerides (38 mg/dl) fasting insulin (9.1 mU/L) and HOMA index (2.3). The results are in line with other studies that showed an increase in triglycerides (33.9 mg/dl),25 fasting insulin (1.5 mU/L), and HOMA index (0.4).26 We hypothesized that the negative changes in the analyzed parameters could be mainly due to the same factors by which body composition is altered: a decrease in daily physical activity levels,1 an increase in sedentary behavior,2,14 dietary changes15 and food preferences such as refined carbohydrates with a decreased intake of fruits and vegetables.16 Interestingly overweight and obesity in the present case represented by negative changes in body weight, BMI and BMI – z are important risk factors for the development of other metabolic comorbidities, such as a metabolic syndrome characterized by insulin resistance and hypertriglyceridemia among other metabolic disorders.27 In the same line, minor levels of physical activity and greater sedentary behavior could be a relationship with a positive energy imbalance and a hunger response characterized by an adiposity signal with increased insulin and leptin secretion (insulin resistance signal).27 This hunger response could be responsible for the changes on dietary changes and food consumption experimented during the COVID–19 lockdowns, which have a negative consequence for metabolic control represented by an increase in pro-inflammatory cascades (IL-6 and TNF – alfa).28 Significantly, the pro-inflammatory cascade plays a fundamental role in the development of insulin resistance and dyslipidemia.29
Another important factor that influenced this lack of metabolic control is the WHtR values, which, although they did not show changes (positive or negative), their mean values are above the 0,60 points which were considered a cut-off point30 for the development of cardiovascular disease and directly influence the appearance of low-grade inflammation29 intimately related to the genesis of dyslipidemia and insulin resistance, whose characteristics can be clearly distinguished in the pediatric population evaluated.
The strength of the present study is to show that the COVID–19 lockdown effects confirmed physical activity,1 sedentary behavior2 and dietary changes15 finally could be impacted negatively in the anthropometric and metabolic control of a pediatric population with overweight and obesity, the above from a public health and Latin American perspective.
In the other hand, this study has some limitations. The authors don't have data for COVID–19 infections in the studied population, and we used the chronological age and not the biological age. In both situations, the authors could be missing the negative effects on the physical characteristics and metabolic profile of an eventual COVID–19 infection and the negative effects on glycemic control or the positive effects on muscle function during the maturational growth in the pediatric population.
ConclusionsThe lockdown due to the COVID–19 pandemic generated a negative impact on body weight, BMI, BMI–z, triglycerides, fasting insulin, and HOMA index in overweight and obese children and adolescents.
Funding sourcesThe present investigation has notreceived any funding from the public or private sector.


